Property analytics for informed decision-making
Gain valuable insights into your virtual tours and property websites with CAPTUR3D’s robust analytics tool. Track key metrics in precise and comprehensive detail, generate targeted reports, and harness the power of data to drive success for your business.
What’s included?
Property Metrics
Dive into the details with comprehensive reports.
- Gain real-time insights into views, visitors, visit duration and leads.
- Find out which traffic sources bring in the most visitors.
- Identify your top geographic areas and filter by country, region and city.
- Understand user preferences with device reports for browser, OS and device size.
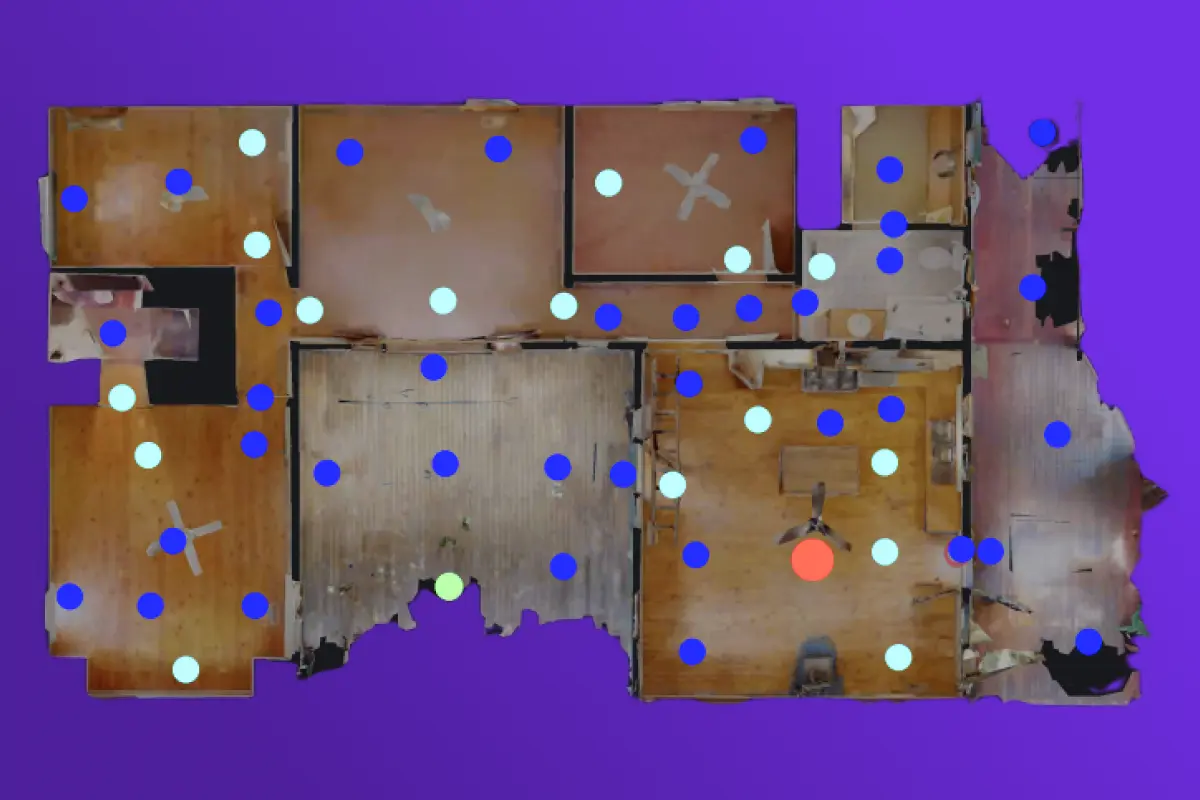
Heat Maps
Find out exactly how your virtual tours and property websites are performing with interactive heat maps. See where users click, how they navigate, and what content catches their attention.
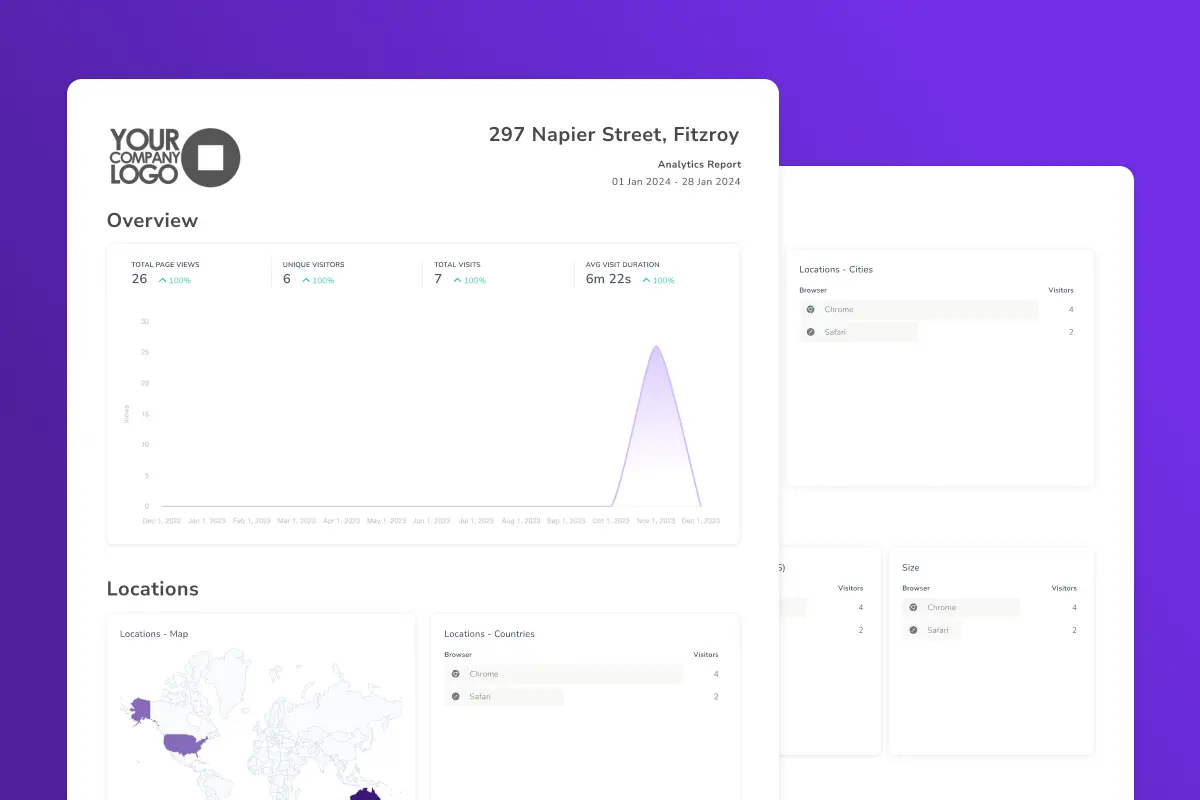
Analytics Reports
Our advanced reporting provides a detailed understanding of user behaviour and engagement patterns, and can be exported in a PDF for easy sharing and analysis.
Report Scheduling
Choose from daily, weekly, or monthly reports to keep your clients informed about the performance of their virtual tours or property websites.
Ready to discover what converts?
Sign up for a 30 day free trial today and receive 75 CAPTUR3D credits to try our services.
Stay on the pulse
Real-time insights
Measure performance with our intuitive analytics dashboard and make data-driven decisions to enhance your business or marketing strategy.
Visualise user engagement
Uncover the hotspots where users spend the most time, understand their navigation paths and optimise your content to help drive even greater engagement.
Streamline reporting
Keep clients in the know with automated analytics reports, scheduled on a regular basis to help them unpack the most valuable and actionable insights.